
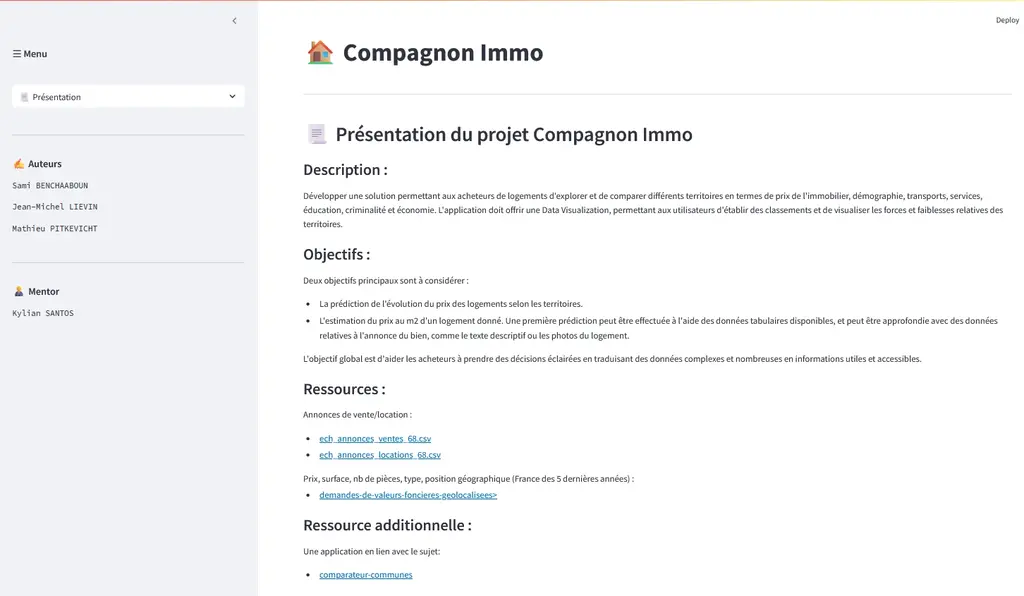
Compagnon Immo
Instruction: Develop a solution that allows home buyers to explore and compare different territories in terms of real estate prices, demographics, transport, services, education, crime, and economy. The application must provide Data Visualization, enabling users to create rankings and visualize the relative strengths and weaknesses of territories. The overall goal is to help buyers make informed decisions by translating complex and numerous data into useful and accessible information.
Architecture
- Python: main language for data collection and processing.
- Pandas: data manipulation and cleaning.
- Scikit-learn: regression and models for price per m² estimation.
- Time series: evolution models (e.g. regularized regression, ARIMA/Prophet, LSTM)
- Matplotlib, Seaborn, Plotly: visualization of trends and metrics.
- Jupyter Notebook: interactive environment for exploration and documentation of analyses.
- Interface: Streamlit for an accessible dashboard.
- ETL: normalization of sources (INSEE, DVF, OpenData)
Compagnon Immo is an academic project carried out as part of my Data Scientist training, as a capstone project. The goal is to develop a solution that allows home buyers to explore and compare different territories in terms of real estate prices, demographics, transport, services, and economy. The application provides interactive Data Visualization, enabling rankings and visualization of the relative strengths and weaknesses of territories.
This project may present some imperfections, linked to the progressive skill development during the training. The quality and output reflect an iterative learning process, with the intention of applying data science tools and methods in a realistic context.
The multiplicity of criteria (price, mobility, education, safety, employment, services) makes the comparison of territories difficult for a non-specialist buyer. Data sources are heterogeneous (formats, granularities, periodicities), and reliable aggregation requires solid standardization. The challenge is to unify this data, weight the criteria according to user preferences, and then expose indicators that are readable to guide the choice.
The solution is based on a complete data science approach, combining exploration, processing, and modeling of data. The goal is to transform heterogeneous data into clear indicators and reliable predictions to help buyers compare territories and estimate property prices.
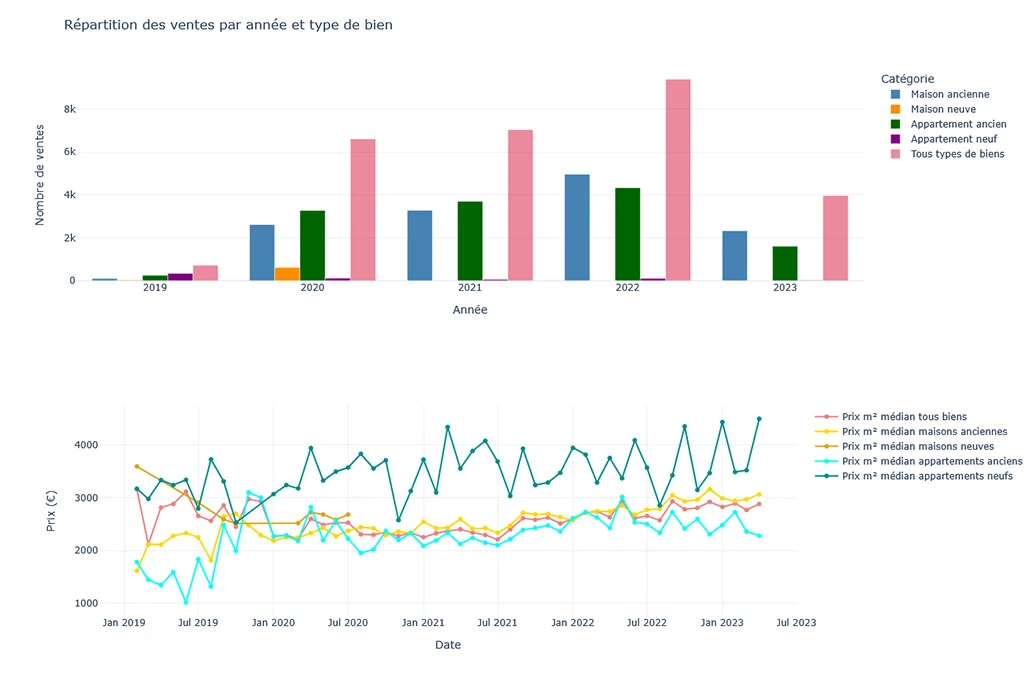
- EDA & Visualization: exploratory data analysis to understand distributions, correlations, and trends, with interactive charts and thematic maps.
- ETL: retrieval, cleaning, and integration of data from various sources (real estate prices, demographics, transport, services, crime, economy).
- Data understanding: highlighting key variables influencing price per m² and local market evolution.
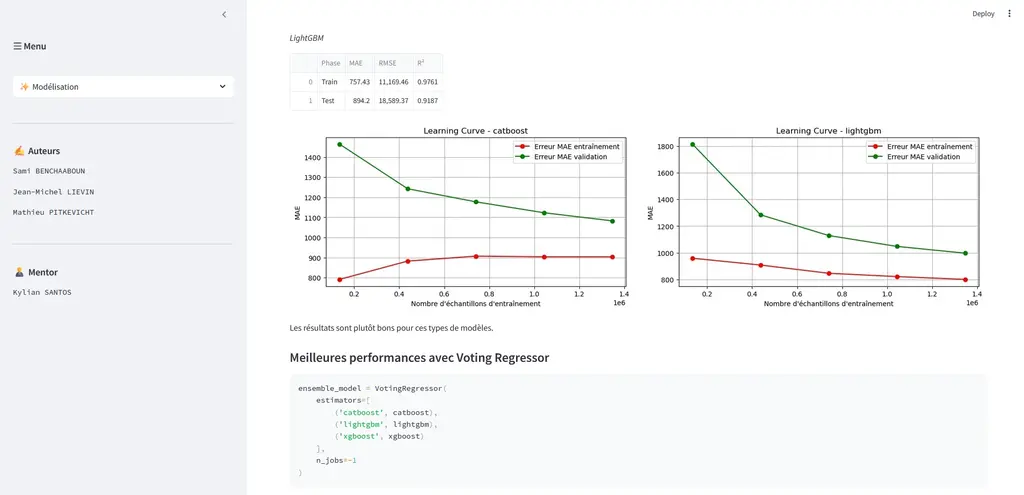
- Modeling: linear regression for initial price estimation and evolution.
- Advanced models testing: experimentation with more complex techniques such as bagging, stacking, and deep learning approaches to improve accuracy.
- Output: presentation of results in an interactive dashboard, allowing users to compare territories and obtain actionable insights.
Key Features
- Streamlit - Interactive UI
- Jupyter Notebook - EDA
- ETL - Data collection & cleaning
- Plotly / Seaborn - Visualizations
- Scikit-learn - Regression & ML
- Time Series - ARIMA / Prophet / LSTM